“Intermediate” Excel With Python
February 20, 2018
In my last post, I shared some examples of “Intermediate” Excel functions in R, focusing on pivot tables and Vlookup. This week, I’m going to look at the same skills but in Python. While R and Python have some similarities, they certainly have their differences as well. I’ll try to point out the subtle differences that tripped me up as I started learning how to do this with Python.
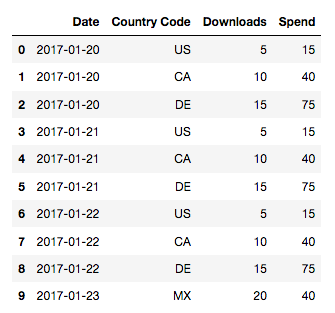
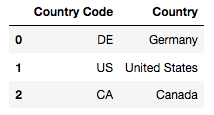
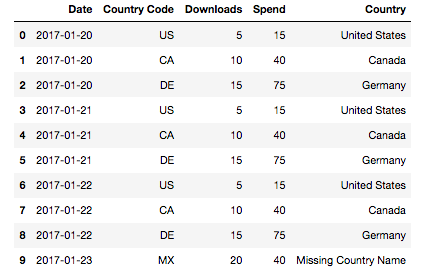
For Python, one of the main modules for data analysis and manipulation is Pandas. It has many functions similar to those found in R’s dplyr. Check out the 10 minute tour of pandas video for quick run through. We’ll also need to use some of NumPy’s functions as well. Let’s take a quick look at the data we used in the R example.
data
countries
Pivot Tables
We’ll use the pivot_table function from the Pandas module.
import pandas as pd
import numpy as np
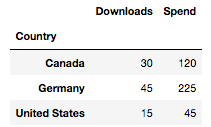
pivot1 = pd.pivot_table(data, index='Country Code', values=['Downloads', 'Spend'], aggfunc=np.sum)
pivot1
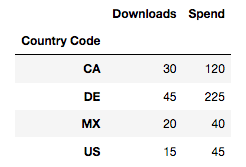
This will produce a pivot table of downloads and spend by Country Code. Reviewing the code, we set the index as the Country Codes, the values as downloads and spend, and finally, we choose to aggregate the data by calling sum. You can think of the index as the “rows” section of Excel’s pivot table field list while the values and aggregation function act just as the “values” section.
Note that we’ve set the pivot table as a variable. I’ve found that filtering on pivot tables works a bit differently. Here are two ways to filter the pivot table.
pivot1.loc[pivot1.index == 'US']
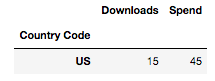
pivot1[pivot1.index.str.contains('US')]
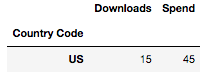
While both of these functions return the same results in this example, they work quite differently. The first, pivot1.loc[pivot1.index == 'US'], is looking for an exact match of ‘US’ on the index. The second, pivot1[pivot1.index.str.contains('US')], is looking for a regular expression match for ‘US’ on the index as well. This means that the second option could potentially return more matches. I tend to think of this as a “looser” filter because it can return matches that are not exact and, in this case, contain 'US'. Each of these examples have their purpose depending on your use case.
There are of course other functions that we can call to aggregate the data.
pd.pivot_table(
  data, index=['Country Code', 'Country'], values='Downloads', aggfunc=[np.sum, np.average, len]
  )
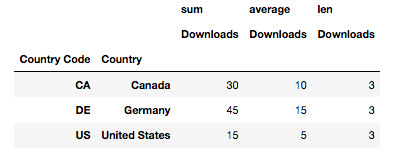
In this example, we’re looking at sum, average, and len. sum and average are intuitive and return exactly what you’d think they return. len is a bit trickier and typically returns the length of an object. In this case, it returns the number of times a given element appears in the data set.
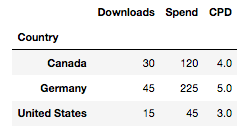
Calculated fields also work a bit differently on the python side of things. I’ve found that it’s easiest to first pivot the data you need, store it as a new data frame, then add the calculated field as a new column. Here’s a quick look at calculating CPD (Cost per Download).
pivot2 = pd.pivot_table(data, index="Country", values=["Downloads", "Spend"], aggfunc=np.sum)

pivot2["CPD"] = pivot2["Spend"] / pivot2["Downloads"]

pivot2
Vlookup
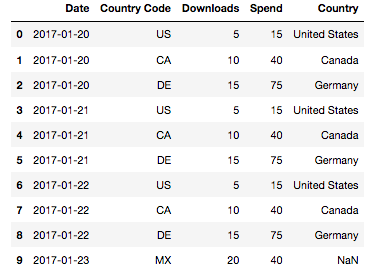
For emulating Vlookup, we’ll use a left join and the merge function. Again, this works a little bit differently from R in the sense that you not only have to mention the column you’d like to join but also specify the type of join. As I mentioned in my last post, I prefer to use a left join because it will force an NaN for any unmatched values which is quite important, especially when working with pivot tables.
data = pd.merge(data, countries, on="Country Code", how="left")

data
If we’d like to quickly fill in the NaNs, we can do something like:
dataV2 = data.fillna("Missing Country Name")

dataV2
Putting Them Together
If we decided leave the NaNs, there are few things to look out for.
pd.pivot_table(data, index="Country", values=["Downloads", "Spend"], aggfunc=np.sum)
When we run this code, we see that the pivot table automatically drops the NaN and no warning message is displayed. Apparently, this is an issue that many users have been working to fix or at least display a message for quite some time.
Having found this issue the hard way, my best practice is to always review and look for any NaNs after a join, especially when I know I’ll be using a pivot table. If an NaN is present, it’s easiest to fill it with some kind of placeholder. The placeholder will give you an opportunity to drop it later or call it out with a note during analysis.
Resources
These notes are only just a quick walk through to get you up and running. There is much more you can do with pivot tables and pandas. For a deeper dive, check out Michal’s Weizman’s Explore Happiness Data Using Python Pivot Tables. Below, I’ve listed a link to a Youtube video by codebasics reviewing pivot and pivot_table. Finally, there are also the links to the documentation for str.contains (the looser filter) and reshaping data.
Code Snippet
import pandas as pd
import numpy as np

# Read in data
data = pd.read_csv("Excel Python or R Data.csv")
countries = pd.read_csv("Country Lookup.csv")

pivot1 = pd.pivot_table(data, index='Country Code', values=['Downloads', 'Spend'], aggfunc=np.sum)

pivot1

# Exact match filter
pivot1.loc[pivot1.index == 'US']

# "Looser" filter
pivot1[pivot1.index.str.contains('US')]

# pivot table using sum, average, and len
pd.pivot_table(data, index=['Country Code', 'Country'], values='Downloads', aggfunc=[np.sum, np.average, len])

# New pivot table for calculated field
pivot2 = pd.pivot_table(data, index="Country", values=["Downloads", "Spend"], aggfunc=np.sum)

# Calculation for calculated field
pivot2["CPD"] = pivot2["Spend"] / pivot2["Downloads"]

pivot2

# Vlookup emulation using merge and a left join
data = pd.merge(data, countries, on="Country Code", how="left")

data

# Replace NaNs with Missing Country Name
dataV2 = data.fillna("Missing Country Name")

dataV2

# Example of pivot_table dropping NaN on Index
pd.pivot_table(data, index="Country", values=["Downloads", "Spend"], aggfunc=np.sum)
Questions, comments, concerns? Please feel free to leave a note below.